
CERC — Environmental Software and Services
- Overview
- Air pollution modelling
- ADMS 6
- ADMS-Roads (Extra)
- ADMS-Urban
- MAQS
- ADMS-Airport
- ADMS-Screen
- Feature comparison
- Emissions management
- EMIT
- Wind energy and airflow
- FLOWSTAR-Energy
- Accidental releases
- GASTAR
- LSMS
- ADMS-Puff
- ADMS-STAR
- Managing model runs
- Run Manager
- Model evaluation
- Model Evaluation Toolkit
- Meteorological data processing
- WRFtoMet
- Related Documentation
- User guides
- Technical specifications
- Model validation
- Newsletters
- Publications
- CERC co-author publications
- CERC software publications
- Presentations
- Other information
- Traffic emissions
- Prices
- Free demo
- Visualisation tools
- Current software versions
- System requirements


ADMS-Urban
World leading urban air quality modelling software
What is ADMS-Urban?

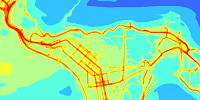
Upper figure City of London, lower figure London conurbation

Annual average NO2 concentrations modelled by ADMS-Urban for 2019. NO2 regions shown in yellow, orange or red exceed the EU limit value of 40 µg/m3
ADMS-Urban is a comprehensive system for modelling air quality across large urban areas, cities and towns at very high spatial resolution (metres). It is the only practical urban air quality model which, drawing on recent research to incorporate the latest scientific understanding, explicitly represents the full range of source types occurring in an urban area, takes account of complex urban morphology including street canyons, and provides output of short and long term average pollutant concentrations from street-scale to urban-scale and, with the regional model link, to larger scales. Model runs can easily be parallelised to take advantage of multi-core PCs to minimise clock time.
Typical applications include:
- assessment of modelled air quality against air quality standards and limit values including those from WHO, EU, UK, USA and China;
- developing and testing policies and action plans for air quality improvement such as Clean Air Zones, Low Emission Zones or low traffic neighbourhoods;
- investigation of air quality management options for a wide range of source types including transport sources;
- source apportionment and source footprint studies;
- air pollution exposure studies;
- air quality and health impact assessments of proposed developments; and
- provision of detailed street-level air quality forecasts.


Annual average NO2 concentrations at 10 m resolution modelled with ADMS-Urban in the UK West Midlands for 2016, with finer zoom for Birmingham. Areas exceeding the air quality standard limit of 40 µg/m3 are shown in orange and red. From Zhong et al. 2019, part of the NERC-funded WM-Air project.


Annual average PM10 concentrations in the main urban areas of Hong Kong Special Administrative Region for 2010. Modelling study carried out by CERC for Hong Kong Environmental Protection Department.
Who uses ADMS-Urban?

Annual average NO2 concentrations for Dublin. Exceedences of the EU air quality limit value of 40 µg/m3 are shown in yellow, orange and red. From an ADMS-Urban modelling study carried out by CERC for the Irish Environmental Protection Agency.

Annual average PM2.5 concentrations in London modelled by ADMS-Urban for 2019. Regions shown in yellow, orange or red exceed the annual average WHO guideline of 10 µg/m3 for PM2.5

Annual average O3 concentrations in London modelled by ADMS-Urban for 2019.
ADMS-Urban is being used in many cities across the world for diverse range of applications. These include air quality policy development, air quality management, air quality forecasting and assessment studies of complex situations in urban areas, cities, towns and close to motorways, roads and large industrial areas.
Recent users and uses of ADMS-Urban include:
- Many local and metropolitan authorities in the UK for their Review and Assessment of air quality and for developing air pollution action plans, clean air zones, low emission zones, low traffic neighbourhoods etc.;
- London, UK: air quality management and policy assessment studies; emission compilation and modelling assessment of proposals for Heathrow Airport; airTEXT air quality forecasting system.
- Manchester, UK: air quality assessment and air quality forecasting.
- West Midlands, UK: air quality and policy assessment.
- China: Beijing: planning the large-scale development (e.g. Olympics Games), air quality forecasting; Shanghai: city planning, traffic sources; Hong Kong: city planning, traffic and airport sources; 5 cities in Liaoning Province: industrial, heating (coal burning) and area sources; Guangdong: air quality forecasting.
- Dublin, Ireland: city-scale modelling, assessing air quality in relation to EU limits.
- Budapest, Hungary: decision-making and air quality forecasting, large industrial sources and traffic sources.
- Johannesburg, Cape Town, South Africa: air quality management.
- Baltic countries: Lithuania - air quality assessments; Riga air quality forecasting.
- France: air quality assessment and forecasting in many cities.
- Rome, Italy: real time traffic management or “now-casting”, traffic sources.
- Bologna, Italy: assessment of new tram system, traffic sources.
- California, USA: health impact assessment.
- Malaysia, Kuala Lumpur: air quality forecasting.
- Singapore: air quality management studies for National Environmental Agency.
- Barcelona: air quality forecasting.
Why use ADMS-Urban?
ADMS-Urban is distinctive in its ability to determine pollutant concentrations at very high (metres) resolution and to describe the physical and chemical processes on a range of scales, from the street scale to the city-wide scale, taking into account the whole range of relevant emission sources: traffic, industrial, commercial, domestic and other less well-defined sources.
The science of ADMS-Urban is advanced and the model takes account of the impacts of urban morphology and street canyons on flow and hence dispersion, turbulence and mixing induced by traffic and includes a photochemical model for NOx and ozone.

This diagram shows some possible inputs to and outputs from the model, and some of the modelling options available.
Predicting pollutant concentrations from an urban area is a complex modelling problem. ADMS-Urban has been developed with a number of features to simplify the modelling process and help users. For example:
| Visualisation | ADMS-Urban includes an integrated GIS we call the Mapper. This automatically displays all geographical model input contained in the interface. One click and you can add a background map to confirm location and assist in adding new sources, receptors and buildings via the Mapper. Simply drag-drop files to add new layers to the map view, with many file formats supported. Saving your layout has never been easier, Mapper project files link your model input file (.upl) to all additional user-added layers, customised just as you last saved them. We also supply a 2-D plotter for generating contour and vector plots from model output. You can use this with the Mapper to overlay output contours on your map, for example. There is a choice of gridding algorithms included in this plotting package, or you can use it with Surfer if you wish. |
|---|---|
| Emissions inventory | Source and emissions data can be imported from CSV files created by the user or exported from CERC's Emissions Inventory Toolkit, EMIT. EMIT contains current and future emission factors including those for vehicles, industrial processes and fuel consumption. |
| Emission factors | ADMS-Urban can automatically calculate traffic emissions for roads based on traffic data. It uses emission factors from Defra's Emission Factor Toolkit (EFT). The EFT includes speed emission coefficient equations taken from the European Environment Agency (EEA) COPERT emission calculation tool. |
| Source-oriented grids | ADMS-Urban automatically generates source-oriented grids of output points. This gives excellent spatial resolution in areas of particular interest at minimal computational cost. |
| User-defined outputs | The user defines the pollutant, the averaging time (which may be an annual average or a shorter period), any percentiles and exceedence values that are of interest, and whether a rolling average is required. The output options are designed to be flexible to cater for the variety of air quality limits, which can vary from country to country and over time. |
Modelling scenarios and future years[top]
In most cases, ADMS-Urban is first used to model the emissions from a base case scenario, that is, data (emissions, meteorology, background, etc.) are used to produce results that can be verified against locally monitored data from a recent previous year or the current year. Once the base case scenario has been validated, it is possible to investigate different scenarios, for example:
Impact of major development
ADMS-Urban is often used to compare air quality before and after major developments. An emissions inventory is compiled using the best available estimates for after the development. ADMS-Urban allows many What if? scenarios to be tried out, predicting concentrations at key receptors or across a wider area.
Future years
The majority of air quality limits may be objectives for future years. Future scenarios can be modelled in ADMS-Urban using Defra's Emission Factor Toolkit emission factors for future years, future predictions from EMIT or the user's own estimate. Likely changes in traffic flows, fleet compositions and background concentrations if known, can also be included in the future scenarios.
Traffic management
If the predictions for future years indicate that concentrations of certain pollutants are likely to exceed the objectives, it is usual to consider traffic management and emission reduction scenarios. For example, some local authorities in the UK are considering introducing Clean Air Zones or Low Emission Zones within which only vehicles that have achieved a particular low-emission standard are allowed. The effect on air quality of introducing such measures can be investigated using ADMS-Urban. CERC's Emissions Inventory Toolkit, EMIT can be used for investigating the effect on emissions.