
CERC — Environmental Software and Services

CERC news
Previous <12345678910111213141516171819Next >
19 Dec 2025MAQS Coupled System 1.4 released
MAQS is CERC's innovative automated system for coupling the high-resolution air quality model ADMS-Urban to a regional air quality model. The output comprises predictions of pollutant concentrations for an urban area, which take into account both regional and local pollutant transport and chemistry effects.
The utilities and scripts in the new version have been updated to include the following features:
- Compatibility with the recently released ADMS-Urban and ADMS-Airport version 5.1
- Automatic update of existing input configuration (.cfg) files from previous versions of MAQS into the new version
- Allows the use of a site properties data file with ADMS-Urban to allow spatially varying site parameters for each grid cell
- Extraction of surface roughness length at the met. site from regional meteorological data files for use by ADMS-Urban
For full details on the changes within MAQS 1.4 please see the What's New document.
17 Dec 2025West Midlands air quality forecasting and alert system launched
The West Midlands Combined Authority (WMCA) launched their new air quality forecasting system for the West Midlands this week. The region’s mayor, Richard Parker, switched the system on yesterday, Tuesday 16th December. Residents can now sign up for air quality alerts and check daily air pollution levels at cleanair.wmca.org.uk.
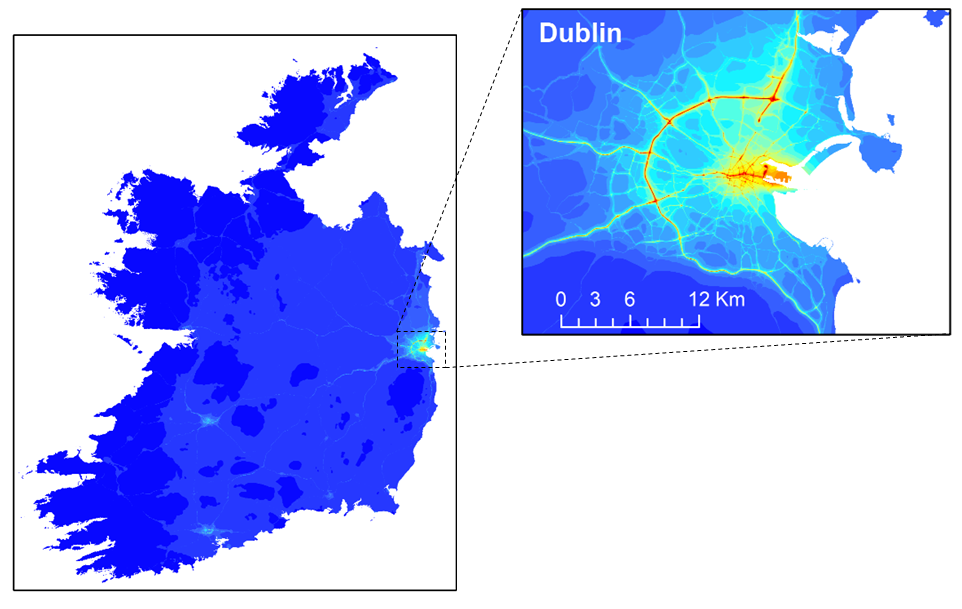
CERC developed and support this system, which generates high-resolution, 3-day air quality forecasts and alerts for the region's seven local authorities. The system delivers geo-referenced 5-metre resolution forecast maps for nitrogen dioxide (NO2), ozone (O3), and particulate matter (PM2.5 and PM10) and alerts via text, email, and voicemail. Alerts are triggered when pollution levels reach moderate
or higher on the UK Government’s Daily Air Quality Index (DAQI). The system is fully integrated into the WMCA's air quality data platform, which also shows current air pollution levels across WMCA's network of air quality sensors.
An innovative feature of this system is that the alert messages are tailored to personal activities. For example, people with wood burning stoves that are not their main heating source will be encouraged to minimise their use when a pollution alert is in effect, to reduce their own pollution exposure as well as their neighbours'. Alert messages also include practical tips to help people minimise their exposure to poor quality air, for example by seeking out areas with lower pollution when exercising outdoors.
CERC has over 15 years of experience in operational air quality forecasting, with a proven track record through services like London's airTEXT, Manchester's Clean Air Greater Manchester service, and York's air quality alert service. These systems are powered by CERC's world-leading ADMS-Urban model, which incorporates local emissions data, urban morphology, and regional pollution transport to deliver street-level accuracy.
The project to develop this system built on CERC's longstanding collaboration with the University of Birmingham through initiatives such as WM-Air, WM-NZ, and WM-Adapt. These projects demonstrate how high-resolution air quality and temperature modelling can inform regional policy, leading to health and environmental benefits over the West Midlands region.
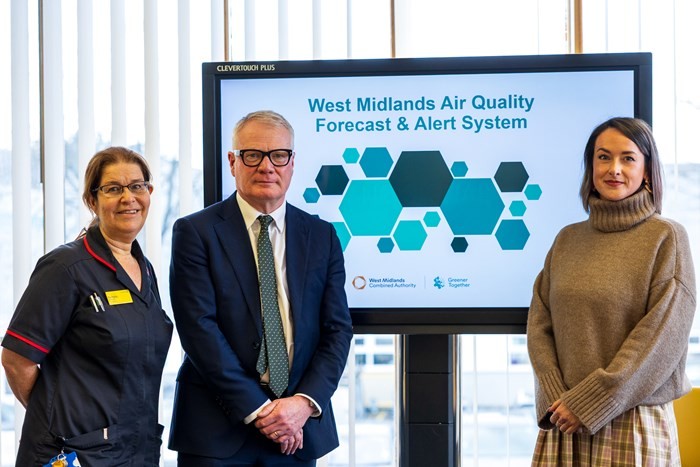
Clean air campaigners and NHS lung health experts have welcomed the action being taken by the Mayor and the WMCA to cut premature deaths linked to poor air quality. The image shows WMCA Mayor Richard Parker with Nicky MacDuff, nurse consultant in respiratory medicine, Royal Wolverhampton NHS Trust, and Florence Cadge, clean air campaigner with Birmingham Healthy Air Coalition.

10 Dec 20252025 ADMS User Group Meetings – presentations are available to download
Following this year's ADMS User Group Meetings, which took place in Bristol on 26-27 November, PDF copies of the presentations are now available to download from the CERC website User Area. Model users with a valid support contract, including all annual licence holders, are entitled to register for password-protected access to the User Area. To register, or to be reminded of your password, click here.


3 Dec 2025Major new release of GASTAR: dense gas dispersion model
GASTAR version 4.0 offers a major redesign for CERC's dense gas dispersion model, harmonising it with the ADMS family in layout and output formats.
GASTAR is typically used for modelling accident and emergency response scenarios and site safety involving releases of flammable and/or toxic materials from accidents such as cryogenic spills, catastrophic tank failure, pipe fractures and multi-phase jets.
New features include:
- An intuitive initial Setup screen for title, source material and all modelling options
- Simplified selection and management of the source material
- Output in CERC's .gst and .gtd formats, compatible with the 2-D plotter
- Support for drag-dropping files (input and output)
- Improved graph colours, symbols and font handling for the integrated line graphs
All the new features are described in detail in the What's New? guide.
As usual with CERC models, the new version is backwardly compatible with earlier versions. Users with support will get this version within the next few working days.
For further information on this release or any CERC products please contact us.


21 Nov 2025Heathrow Airport expansion proposal: air quality sensitivity analysis
As part of the review of the Airports National Policy Statement (ANPS), the UK Government assessed Heathrow Airport expansion proposals produced by seven organisations. Two schemes remain under active consideration by the Government. For one of these, the Heathrow West scheme, promoted by Arora Group / Heathrow West Limited, CERC was part of a support team of specialist consultants engaged by Arora Group for their submission to the ANPS review. For the proposed expansion scheme, which includes a 2,800 m third runway, CERC's air quality analysis included:
- a semi-quantitative analysis of operational phase human health impacts;
- a qualitative analysis of relative potential effects at ecological receptors; and
- a further qualitative analysis of construction phase impacts.
As part of our analysis, we considered potential traffic disruptions during the construction of road schemes relating to airport expansion. These were based on disruption caused by current works for upgrading M25 Junction 10; the figure shows traffic speeds recorded for a section of the M25 before and during the works. This is an area of concern for which the Government has requested further information from promoters of the two remaining schemes. CERC's report is included as Appendix D of Arora Group's submission, with a summary of the air quality analysis in Section 10.
You can also follow CERC news on Facebook, X, LinkedIn and by RSS.
Previous <12345678910111213141516171819Next >