
CERC — Environmental Software and Services

- Overview
- Atmospheric dispersion
- Atmospheric chemistry
- Urban air quality
- Regional to local air quality modelling
- Vehicles and roads
- Aviation
- Emissions
- Urban heat island
- Atmospheric boundary layer
- Wind energy
- Hazardous releases
- Inverse dispersion modelling
- Net Zero
- Model evaluation
- Smart cities
- Web platforms
- Older projects
- CERC co-author publications
- CERC software publications
- Presentations
Emissions
Quick links: Low Emissions Toolkit EMFAC-HK Conversion Tool Verification of CO2 emissionsCOVID-19 emission reduction
CERC has expertise in investigating air quality emissions from the full range of sources, including the transport, domestic, industrial and commercial sectors. For example, we have taken steps to improve on published diesel car emission factors using real world emissions data. Our consultancy team provide services such as calculation and manipulation of emissions inventories and assessment of Clean Air Zones. Our ADMS-Roads, ADMS-Urban and ADMS-Airport software automatically calculates road traffic emissions using built-in datasets such as the UK Emissions Factors Toolkit. EMIT software is a comprehensive tool for fast and straightforward calculation and analysis of emissions inventories. EMIT incorporates over fifty emissions calculation datasets, including datasets for UK road traffic. Our COPERT to EMIT tool (available from our User Area) allows road traffic emissions from the European Environment Agencys COPERT software to be imported into EMIT.
CERC have developed custom tools for calculating and manipulating emissions in several research projects.
- The Low Emissions Toolkit enables UK local authorities to assess the costs and benefits of low emission strategies.
- The EMFAC-HK Conversion Tool enables the Hong Kong Environmental Protection Department to use emissions calculated from its Emission Factors Model for Hong Kong (EMFAC-HK) in the ADMS-Urban dispersion model.
Low Emissions Toolkit
The Low Emissions Toolkit (LET) was developed in 2010-11 by CERC with TTR (now part of TRL) and RPS for the Low Emission Strategies Partnership. The purpose of the tool is to enable UK local authority planners and fleet managers to assess the costs and benefits of low emission strategies. The tool quantifies changes in emissions of local pollutants and greenhouse gases, and the associated cost and benefits, due to the introduction of low emissions strategies. CERC created the tool as an Excel spreadsheet which performs all the calculations and creates graphical visualisations of the costs and benefits. A review of the LET and overall method by Air Quality Consultants and Aether concluded that it was a streamlined and efficient approach to estimating emission reductions associated with fleets and planning developments.
Learn more
- A presentation on the LET (.pdf, <1MB)
EMFAC-HK to ADMS-Urban Conversion Tool
In 2015 CERC developed an emissions conversion software tool for the Hong Kong Environmental Protection Department (HK EPD). The EPD carries out emissions calculations with its Emission Factors Model for Hong Kong (EMFAC-HK), which contains detailed road fleet data for the Hong Kong region. CERC developed a tool to convert the output from this model into data ready for use in the ADMS-Urban dispersion model, including the calculation of road-by-road emissions by combining traffic activity data with the emission factors produced by EMFAC-HK. The tool development supported a project by the Hong Kong University of Science and Technology (HKUST) for the HK EPD, in which ADMS-Urban was used to model the air quality in Hong Kong, taking into account its unique topographical features and deep street canyons. CERC were contracted by HKUST to develop the conversion tool for the HK EPD.
Verification of CO2 emissions
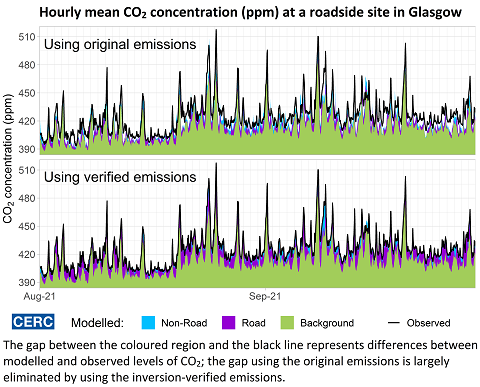
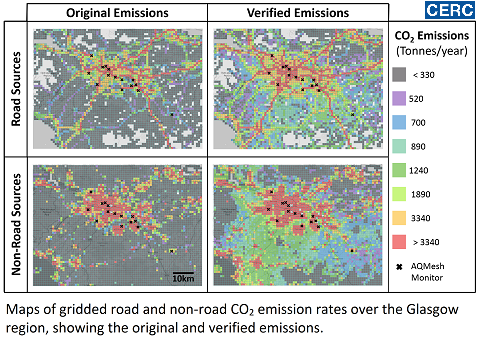
Verification of CO2 emissions is essential to achieving Net Zero and keeping 1.5 alive. Researchers from CERC, Cambridge University, and ACOEM collaborated to verify CO2 emissions in Glasgow by combining measurements and ADMS-Urban model output. The study, using available traffic data and emissions factors, suggested that CO2 emissions from road traffic around Glasgow could be underestimated by up to 20%. These methods could be applied to verify the effectiveness of Net Zero policies.
15 AQMesh pods were co-located with Scottish Air Quality Network reference monitors at a number of sites, taking measurements of CO2 and other pollutants at 1-minute resolution. In addition, two LI-COR reference-grade instruments measured CO2 at 1-minute resolution. ADMS-Urban was applied to calculate hourly CO2 concentrations at the measurement sites for the period of the measurements using NAEI gridded emissions and DfT traffic flows, and allowing for the effects of street canyons. Road emissions within 2km of each monitoring site were modelled explicitly as road sources; other road emissions were modelled as 1km x 1km gridded emissions. Hourly background CO2 was obtained from hourly baselines of the 1-minute AQMesh measurements calculated by the University of Cambridge team.
CERC applied Bayesian based inversion techniques to combine hourly modelled CO2 concentrations with hourly AQMesh and LI-COR measurements. The technique allows for the differences in uncertainty between the low-cost sensors and the reference monitors, for the uncertainties of the emissions from each source and for correlations between source emissions. The differences between the original and inversion-verified emissions provide an indication of the accuracy of the original emissions inventory.
The project was funded by NERC and the Scottish Government.
Assessing the drop in road traffic emissions during COVID-19 restrictions
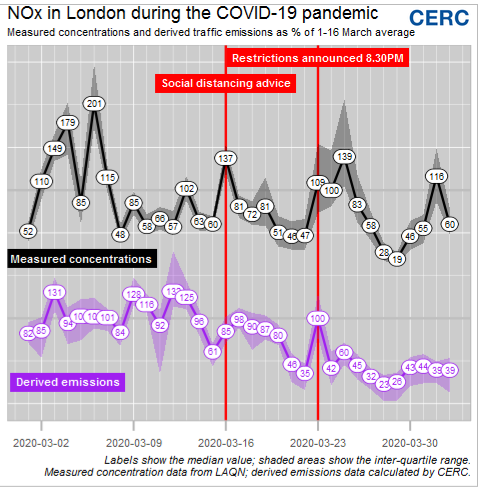
The restrictions imposed by the UK Government in 2020 to limit the spread of COVID-19 led to unprecedented reductions in the volume of road traffic; Government figures suggested that vehicle use dropped to 40% of normal levels. Discerning the impact of this on air quality in our towns and cities is difficult however, because air quality is heavily dependent on the weather. In typical windy UK conditions, poor air is rapidly mixed with cleaner air from above, so only those nearest to the busiest roads experience poor air quality. However, when the wind is light, as it was during the fine sunny weather that immediately followed the imposition of COVID-19 restrictions on 23 March 2020, traffic pollution emitted into stagnant air builds up, leading to more widespread poor air quality. So how can we tease out the impact of the known recent reduction in vehicle use from measured air quality data?
Scientists at CERC analysed air quality data from across London using a mathematical technique that combines measured air pollution concentration data with results from ADMS-Urban to derive an estimate of the underlying road traffic emissions that caused the measured concentrations. The figure shows how measured concentrations and derived emissions changed during the period of restrictions. The derived emissions first show a marked drop over the weekend of 21/22 March, which coincides with the announcement on the evening of Friday 20 March that bars and restaurants should close. Monday 23 March saw a widely-reported rush hour in London; this can be seen in both the measured concentrations and the derived emissions. The impact of the restrictions announced in the evening of 23 March can be seen in the derived emissions in the following days, even though measured concentrations continued to rise through Wednesday, due to the sunny and still weather conditions. The lowest derived emissions are seen on the weekend of 28/29 March, averaging 24% of pre-restriction levels. Weekday derived emissions of consistently around 40% of pre-restriction levels contrasts with a second peak in measured concentrations on 1 April, again due to still weather conditions.
By combining air quality monitoring with dispersion modelling, CERC scientists were able to show that as well as limiting the spread of COVID-19, the Government restrictions led to a reduction in traffic emissions in London. In more normal times, this type of analysis can help uncover the true impact of emissions-reduction strategies on local air quality.