
CERC — Environmental Software and Services
- Overview
- Air pollution modelling
- ADMS 6
- ADMS-Roads (Extra)
- ADMS-Urban
- MAQS
- ADMS-Airport
- ADMS-Screen
- Feature comparison
- Emissions management
- EMIT
- Wind energy and airflow
- FLOWSTAR-Energy
- Accidental releases
- GASTAR
- LSMS
- ADMS-Puff
- ADMS-STAR
- Managing model runs
- Run Manager
- Model evaluation
- Model Evaluation Toolkit
- Meteorological data processing
- WRFtoMet
- Related Documentation
- User guides
- Technical specifications
- Model validation
- Newsletters
- Publications
- CERC co-author publications
- CERC software publications
- Presentations
- Other information
- Traffic emissions
- Prices
- Free demo
- Visualisation tools
- Current software versions
- System requirements


ADMS-Airport
Comprehensive software for air quality management for airports
Model input data
Emissions sources
ADMS-Airport air quality model is a comprehensive tool for managing air quality at airports. It can be used to examine emissions from up to 8000 sources simultaneously, including:
- Aircraft jet sources, up to 500 aircraft jet sources.
- Road traffic, up to 150,000 road links (3000 road sources each with up to 51 vertices).
- Industrial sources, up to 1500 point, line, area or volume sources.
- Aggregated sources (grid source), up to 3000 grid cells can be used to model emissions from sources that are too small to define explicitly, for example, emissions from domestic housing.
Source parameters include:
- for aircraft sources, engine category, number of engines, start and end locations of the straight line along which the aircraft travels, and start and end aircraft speeds;
- source location data;
- road widths and canyon heights for road sources;
- stack heights, diameters, exit velocities, etc., for industrial sources;
- grid dimensions for aggregated emissions data.

Emissions profiles
User-defined emissions profiles can be included in any modelling run to take into account the diurnal variation in traffic flows.
Seasonal variations can also be included with monthly profiles.
Variation of sources with wind direction—particularly useful for airport sources—can also be modelled.
For more detailed modelling, annual hourly profiles can also be modelled.
Meteorological data
A variety of meteorological data can be used for input and the format required is deliberately kept very simple.
Wind speed, wind direction and temperature are required along with cloud cover, heat flux or solar radiation.
The meteorological pre-processor calculates the necessary boundary layer parameters from the user's input.
There are a variety of suppliers of meteorological data across the world. A CERC meteorological data converter can convert METAR and other NWS data to ADMS format.
Traffic flow

For road sources, the user can enter hourly speed and traffic flow data into the model and use ADMS-Airport's built-in emission factors or, alternatively, the user can enter pre-calculated emissions data, for example emissions calculated within CERC's Emissions Inventory Toolkit, EMIT, which includes many factors such as current and future factors for Euro standard engines.
Modelling roads in urban areas is more complex than just modelling the emissions from traffic as a line source. Both the effect of street canyons and traffic-induced turbulence are included when roads are modelled in ADMS-Airport.
Background ambient concentrations
When modelling any local emissions, it is important to include the background ambient concentrations that are advected from outside the modelling area. Background ambient concentrations can be hourly values, or if these are not available, constant values can be assumed.
In the UK, these background data can be downloaded from the Defra Data Archive website (http://uk-air.defra.gov.uk/data/data_selector) and included directly in any ADMS-Airport modelling scenario.
Aggregated emissions
In urban areas, it is also important to include the aggregated emissions from sources that may be too small to define explicitly, but whose aggregate emissions contribute to overall pollution levels. For example, domestic emissions of NOx from an individual household may not be known, but the aggregated emissions could be calculated using area-wide figures for fuel consumption. In ADMS-Airport, a grid source with up to 3000 grid cells can be included in any run to represent these aggregated emissions.
Model output data[top]

Pollution concentrations can be calculated for averaging times ranging from seconds up to years. ADMS-Airport can calculate percentiles, the number of exceedences of threshold concentrations and rolling averages. These options allow users to compare concentration results directly with appropriate limits, for example those given by the UK NAQS, US NAAQS, EU or WHO.
Model results are usually first verified by making comparisons with locally monitored data. This can be done by outputting results at receptor points corresponding to monitoring site locations. Modelled and monitored concentrations can then be compared as a time series plot.
Source-oriented gridding
Results created by ADMS-Airport are often presented as colour contour plots. The source-oriented gridding enables users to model a large area yet obtain high spatial resolution in areas of particular interest—e.g. in and around the roads. The ADMS-Airport contour plots are an extremely effective way of communicating results to decision makers, the public and other stakeholders.
Why do you need source-oriented gridding?
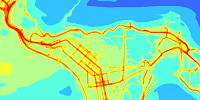
Source-oriented gridding gives high resolution of results where it is needed—e.g. in and around the roads. The three figures below show an area of 1.4 km2 with approximately 5-km length of roads being modelled.
- (1) shows concentration results using the source-oriented gridding option, and
- (2) shows concentration results without the source-oriented gridding option—this type of output is typical of other roads models that do not have the source-oriented gridding option.
The roads are shown in red and the output points used to create (1) as black dots. Both regular grid points and extra source-oriented gridding points inside and either side of the road are shown. The spacing of the source-oriented gridding points is related to the width of the road, and the user can vary the along-road spacing.

(1) Concentration results using the source-oriented gridding option. The contours reveal the shape of the roads and the high concentrations (i.e. those shown in yellow, orange and red) are fully resolved.
(2) Concentration results using only a regular grid with a resolution of approximately 70 m. Although the locations of the roads can be seen, results are in general very blobby.