
CERC — Environmental Software and Services
- Overview
- Air pollution modelling
- ADMS 6
- ADMS-Roads (Extra)
- ADMS-Urban
- MAQS
- ADMS-Airport
- ADMS-Screen
- Feature comparison
- Emissions management
- EMIT
- Wind energy and airflow
- FLOWSTAR-Energy
- Accidental releases
- GASTAR
- LSMS
- ADMS-Puff
- ADMS-STAR
- Managing model runs
- Run Manager
- Model evaluation
- Model Evaluation Toolkit
- Meteorological data processing
- WRFtoMet
- Related Documentation
- User guides
- Technical specifications
- Model validation
- Newsletters
- Publications
- CERC co-author publications
- CERC software publications
- Presentations
- Other information
- Traffic emissions
- Prices
- Free demo
- Visualisation tools
- Current software versions
- System requirements


EMIT
Comprehensive emissions inventory toolkit
Tool input data
Emissions sources
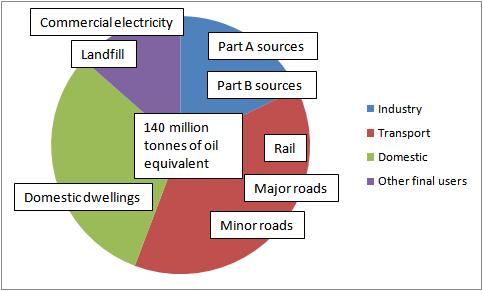
UK inland energy consumption for 2012
EMIT can store emissions data from a variety of sources. These broadly fall into two categories.
Firstly there are the explicit sources such as:
- major roads,
- rail and
- industrial sources (point and area).
Secondly, EMIT can hold data from sources that may be too small to be considered explicitly, and instead are treated as average emissions on a 1 km2 grid, such as:
- minor road,
- commercial, and
- domestic sources.
Emissions calculations
Sources with known emission rates can be imported directly, for example, the emissions from Part A industrial sources can be downloaded from the UK Pollutant Release and Transfer Register (UK PRTR).
However, explicit emissions from most sources are not known. This means that emissions have to be estimated. This can be done in one of two ways.
Firstly, emissions can be calculated from activity data, such as traffic flows for road and rail traffic, and fuel consumption for industrial sources. Below are examples of activity data for various sources whose emissions can be estimated in EMIT (some or all of the activity data listed may be required to estimate emissions).
- Agriculture, e.g. number of animals, land area, fuel used.
- Industrial plants, e.g. amount of raw materials consumed, amount of product, fuel consumption.
- Road and rail traffic, e.g. traffic flows, fleet compositions, number of vehicle kilometres, number of trips.
- Air traffic, e.g. number of landing/take off cycles, fuel consumption.
- Electricity, e.g. number of kWh, fuel consumption used.
- Landfill, e.g. volume of landfill.
- Commercial and domestic heating, e.g. house type, fuel type, insulation, heating efficiency.
In order to calculate emissions from activity data, associated emission factor datasets are required. Over fifty datasets are held in EMIT. The table below gives some examples.
| Road traffic | EMIT includes road traffic emission factors from DfT and from Defra's Emission Factor Toolkit, and datasets to estimate emissions from resuspension, brake wear, tyre wear and road wear. |
|---|---|
| Rail traffic | Relevant data from the UK Emission factor Database (UK EFD) have been collated and included in the database. |
| Aircraft | Emission factors are included for jet aircraft engines (from the ICAO databank), turboprop and piston engines, auxiliary power units, and ground support equipment. The ICAO databank factors include PM10 emissions calculated by the First Order Approximation method version 3. |
| Industry | Hundreds of emissions factors for industrial sources have been included using data from the UK Emission factor Database (UK EFD). |
| Electricity | Datasets have been included in EMIT to estimate emissions from electricity, both in terms of the fuel used for power generation, and also using end-use values of electricity consumption in terms of the number of kWh used. |
Emission factors are included for the following pollutants:
- 9 local Air Quality Strategy pollutants: oxides of nitrogen (NOx and nitrogen dioxide), particulate matter (PM2.5, PM10), sulphur dioxide, carbon monoxide, lead, benzene and 1,3-butadiene
- Many other pollutants including carbon dioxide, methane, volatile organic compounds (VOC), mercury and benzo[a]pyrene
Full details and references for all the datasets in EMIT are contained in the User Guide.
Secondly, emissions can be estimated as a scaling of a national emissions figure by a local statistic. For example, the local population is often a good indicator of emissions—if you were to scale the total emissions from landfill sites in the UK by the ratio of the local to national population, this would give an estimate of the emissions from landfill that could be attributed to the local population.
Emissions inventory
CERC provides training on compiling an emissions inventory. The course focuses on collating data for use in air dispersion modelling and covers the type of sources to include in an inventory, the data format, calculating emissions, locating emission factors, and aggregating sources into grids.
Tool output data[top]
Import and export
Emissions data in the following formats can be imported directly into EMIT:

- ArcView shape files,
- MapInfo Professional MIF files, and
- Comma Separated Variable (.csv) files.
Once data manipulations and calculations within EMIT have been performed as required, emissions data can be exported from EMIT as ArcView shape files. For major roads data, these files can be imported directly into noise mapping software that implements the UK noise standard Calculation of Road Traffic Noise (CRTN).
Alternatively, the data can be exported to a format that can be imported directly into CERC's air quality management tool, ADMS-Urban/ADMS-Roads for use in local air quality assessments of Air Quality Strategy pollutants, or to the industrial assessment model, ADMS 6.
Emissions totals are displayed in the EMIT interface, and can be copied and pasted into other packages for editing, use in reports and so forth.
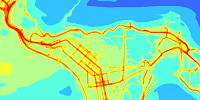
Viewing and manipulating data

(Click to enlarge)
EMIT contains an integrated visualisation and manipulation utility called the EMIT Mapper. It allows source data not only to be displayed graphically but also manipulated. New sources may be added and existing sources may be moved between groups. The geometry of a source may be changed directly, perhaps by using background map data as a guide. Additionally, sources may be edited via their EMIT source data screens. The map created in the EMIT Mapper can be copied and pasted into other packages such as Microsoft Word.
The Mapper allows the user to choose which source types to show or hide. Sources can then be selected and are highlighted in red in the above image and also listed in the Selections window.
The Mapper has various GIS tools and options are available for filtering and shading the sources.
The Database Explorer displays all the inventories within the database and the source groups within each inventory.